Solar Manager's
Operations Index
Your guide to confidently drive the best outcomes
in complex solar facilities
Our Operations Index delivers quantitative metrics in three core areas
Quantify performance
Compare performance across key categories & metrics, normalised for asset size and type
Identify opportunities
Gap to potential sized, with opportunity sizing based on trends and rankings to prioritise actions
Production
Production
Drive maximum generation & understand how your production compares to peers
Safety
Safety
Understand relative safety performance of your operational assets vs. peers
Costs
Costs
Optimise your operational expenditure
Solar Manager's
Opex Report
Get a clear and complete picture of operational costs and right-size your spend

Instantly drive additional value in your operations
Unique insight
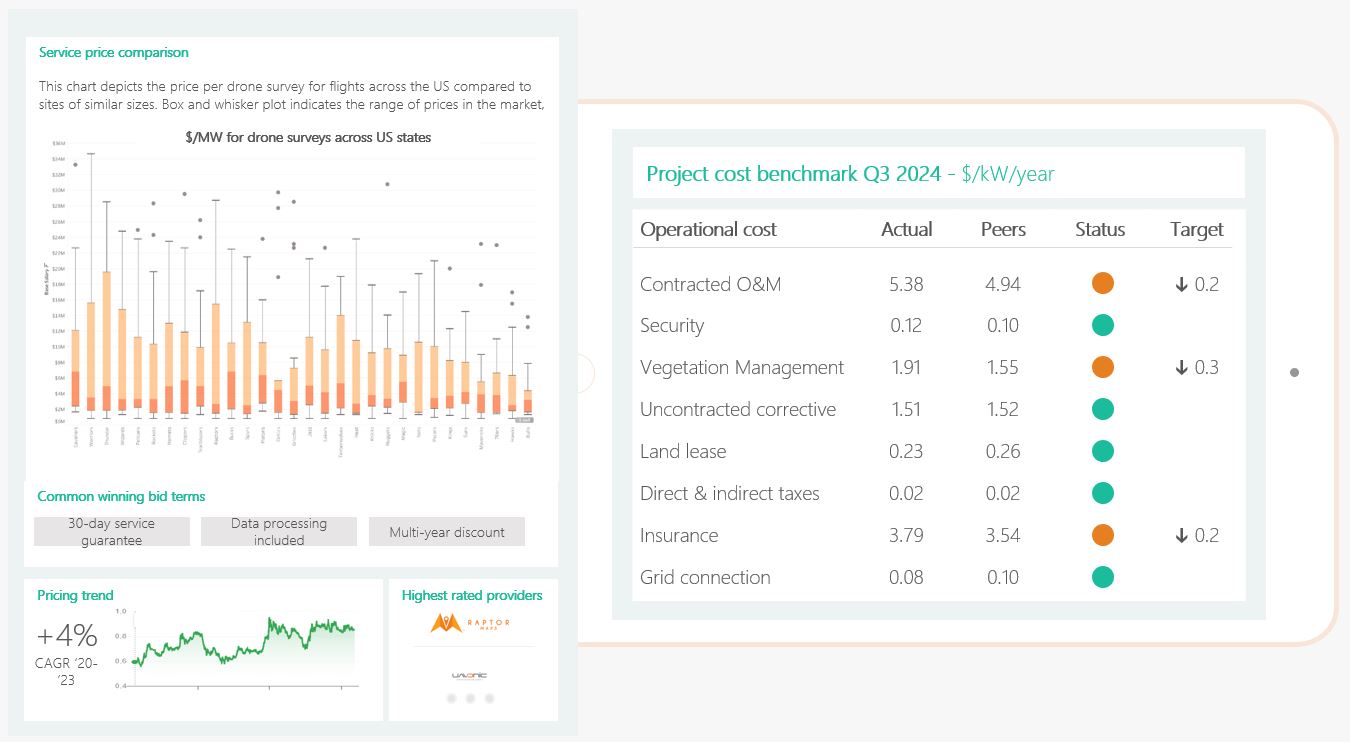
Access the industry’s only Opex report with insights from our benchmark and real, freshly updated price offers from our marketplace.
Fresh perspectives
Explore the pricing dynamics of services from different angles (historic, geographic, contractual)
Confidential
Sanitised and normalised per MW to ensure confidentiality and optimal comparability
Free
-
Executive summary
-
Key Opex trends, by project size
-
P25 pricing levels
Premium
-
All expert analysis
-
Key operational cost data insights
(P10 to P90, costs by country, by project size) -
Projected cost trends
-
Market composition
-
Contract attributes
How clients use our benchmarks & analytics
Investors
Be informed to drive continual improved performance in your asset
Asset Managers
Know what to expect in today’s operations market and how to budget
Service providers
Understand the competitive dynamics in a particular region or service category
